
lith: The Runtime Under Our Go Apps
lith is the open-source runtime under our multiplayer Go apps on SQLite and Datastar: one writer, one render per tick, compressed HTML streams, all measured.

- Hypermedia for ordinary apps
- The same architecture, built by hand in each app
- Linear writes: one writer, batched transactions
- Immediate mode: the view is a function of the state
- Ticks: one render per view and tick
- Hypermedia: one compressor per stream, zstd or brotli
- SQLite, Chromium and brotli findings
- What lith leaves to the app
- A first command and live view
- Deployment scope: one process, one host
- Where lith runs
- Credits
- Limitations
- Starting a project
lith is the runtime under our Go apps on SQLite and Datastar. Pages are rendered on the server and stay live over one stream per tab, so multiplayer needs no extra code.
- Linear writes: one writer applies every command in order, in batched transactions. On its own it commits 80,530 commands a second on a VPS for 10 dollars a month (synthetic, without HTTP).
- Immediate mode: a page is a function of the database; no client state has to be kept in sync with the server.
- Ticks: a changed view renders once per tick for everyone who has it open. 200 tabs on one board take 55% of a core (in process).
- Hypermedia: HTML goes out over Server-Sent Events, compressed per stream. A repeated frame of 142 KB costs 2.2 KB, and zstd needs about half of brotli's CPU.
Open source (MIT), pure Go, one binary without cgo. lith owns the runtime only: routes, templates and the domain model stay with the app.
Hypermedia for ordinary apps
In a hypermedia app the server sends HTML, not JSON. The browser runs Datastar, a small library that takes each piece of HTML from the server and morphs it into the page by element id. There is no JSON API and no client state that has to mirror the server: the page shows what the server last rendered.
Business software is mostly forms, lists, tables and admin screens, and so are the apps we have built this way: this site, Starbase, the kanban board, Tickit and Libretto. For them the model has three advantages over a single-page app:
- One render function per view replaces three things a single-page app has to keep in step: the API that serves the data, the store in the browser that holds it, and the templates in the browser that draw it.
- A form posts a command. The server checks it, writes it and answers with an empty
204. The view renders again from the database, and the page gets the new HTML on its stream. - Multiplayer is built in: live updates for several people come from the same code. Every view is already a function of the database: when a command changes a row, every open tab that shows it gets the new version. Nobody writes a second path for "someone else changed this".
What this does to loading, transfer and JavaScript on a slow phone is in our comparison of a Next.js chatbot with its hypermedia rebuild, and for a shared board in our comparison of the kanban board with PLANKA.
The same architecture, built by hand in each app
Our own apps and several client projects run on Go, SQLite and Datastar. When we laid them side by side, each had built the same runtime by hand, each in its own way: a writer for SQLite, something that decides when to render, and a stream of server-sent events per tab.
In detail: some apps serialised their writes by giving the database pool a single connection (SetMaxOpenConns(1)), with no queue and no batching, and reads waited behind the write connection. One app committed an event and its projection to two different database files per command. Most rendered every view again for every stream on every change. Each stream held its own compressor with brotli's default window, 9.9 MiB per open tab in one app. And in several projects the documentation described a single writer that the code did not have.
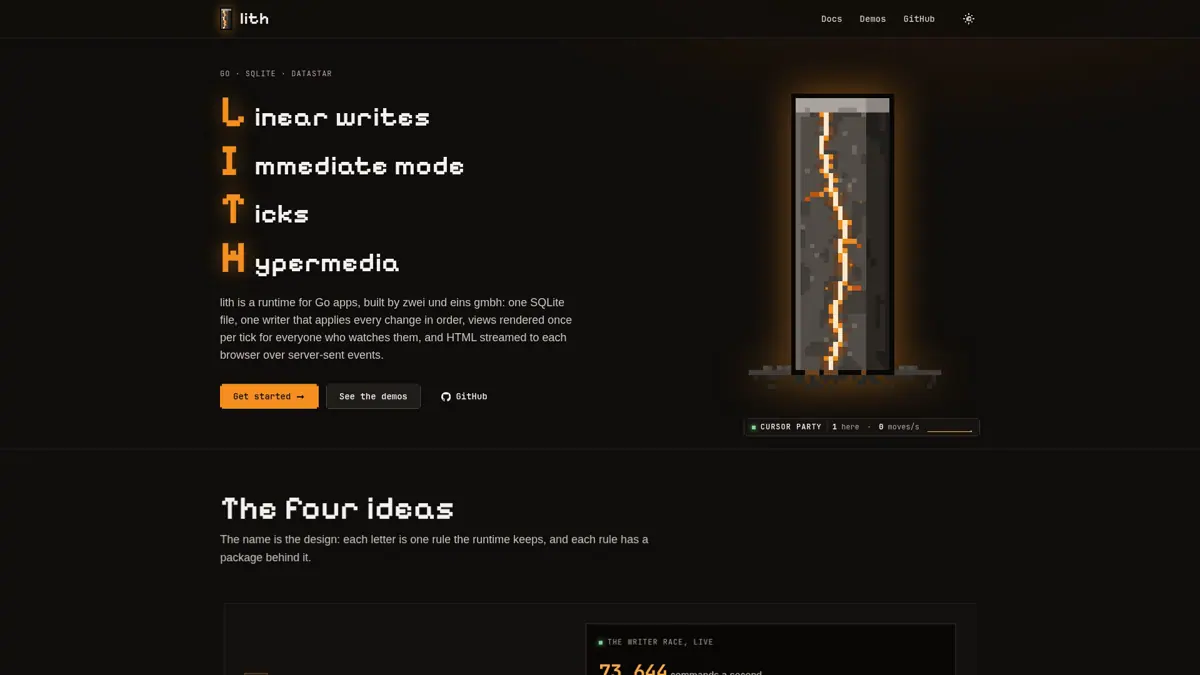
lith is that runtime written once, as a Go library. Its name lists its four parts: Linear writes, Immediate mode, Ticks and Hypermedia. The current version is v0.5.0.
Linear writes: one writer, batched transactions
SQLite lets one connection write at a time. If every request writes from its own goroutine, they all queue for the lock, and past the busy timeout some fail with SQLITE_BUSY. lith gives the write connection to one goroutine, the writer. Every change is a command, and the writer applies the commands in the order they arrive. While one transaction commits, the next commands wait, and the writer takes up to 512 of them into one BEGIN IMMEDIATE transaction, each in a savepoint of its own. A command that fails rolls back only its savepoint. There is no optimistic retry loop: a command sees every command before it.
Batching is what makes synchronous=FULL affordable, where every commit waits for the disk. One producer alone gets 526 commands a second on our development machine (an Intel i5-13500), with one fsync of 1.9 ms for each. Fifty producers share each fsync, 25 commands at a time, and get 25 times as far. At 200 producers a transaction takes 122 commands, and the writer commits 34,893 a second. It needs no tuning for that: under load, more commands share each commit.
Commands a second, writer alone
On the VPS that serves lith's website, four vCPUs of an AMD EPYC and 4 GB of memory for about 10 dollars a month, the same benchmark commits 80,530 commands a second at 200 producers with synchronous=NORMAL, 108 to a transaction. With NORMAL the CPU limits the writer, at about 13 µs per command. In a profile the writer's own code (queue, savepoints, statement cache) is under 2%; SQLite, database/sql with the driver, and the garbage collector take the rest.
NORMAL is lith's default, and it has fine print. A crash of the process loses nothing. A power loss or a kernel crash, though, can undo up to about 35 seconds of acknowledged commits with Linux's default writeback. Where that matters, an app sets FULL and pays one fsync per batch: on the VPS, whose fsync takes about 7 ms, that is 14,480 commands a second at 200 producers. On the development machine, beside a board with 200 open streams, a command commits in 0.3 to 0.5 ms at p50 with NORMAL and in 2.7 to 5.5 ms with FULL. At p99 it took 11 ms with FULL and 29 ms with NORMAL while the streams used zstd, and 7.4 and 12 ms with brotli. Those tails are the host's shared SSD pool's: NORMAL's ranged from 1.4 to 49 ms between runs (synchronous FULL against NORMAL).
Immediate mode: the view is a function of the state
A region of a page is view = f(state): one render function that reads from the database and returns HTML. It renders the view whole, and Datastar morphs it into the page. The server keeps no diff of what the browser has, and the browser has no reducer. Nothing in the browser predicts what the server will do, so there is no optimistic update to roll back when the server refuses. The name comes from immediate-mode UIs, which draw the whole screen from the state on every frame.
The price is bytes. Rendering whole views sends the same HTML again and again: the shared board in our benchmarks is 142,067 bytes per frame. Compression takes most of it back, because each stream keeps a window over its own past, and a frame that repeats the last one but for one card refers back to it. On the VPS that board went out at 2,188 bytes per frame, 65:1.
One rule follows: a GET never writes. No session row, no visit counter. Crawlers multiply every write a GET makes.
Ticks: one render per view and tick
The hub decides when to render, not the request. A commit touches topics, the topics mark views dirty, and every 50 ms (the default tick) each dirty view renders once, in one read transaction, for every stream that watches it. However many commits land in one tick, each changed view renders once.
Our benchmark for this is the kanban board's 200-tab run without HTTP: 200 streams on one board of 200 cards while 200 producers send 800 commands a second, so the board changes in every tick. On the development machine it ran at 19.8 ticks a second and 1.00 render per tick, sent about 3,960 frames a second and dropped none. On the VPS the whole run kept 55% of a core busy, with a tick p95 of 1.1 ms.
A stream keeps only the newest frame per view, so a slow client skips frames and holds up nobody. A view also does not render while every stream that watches it still has a frame waiting. We measured that with 50 tabs whose clients had stopped reading, each with a 34 KB view of its own that changes every tick: without the rule the hub needed about 1.5 cores, with it 0.03 to 0.05. Streams that keep up cost the same as before.
A shared board, measured
A small multiplayer demo: everyone reading this post right now sees the same board. A click colours a tile in your tab's colour: the page sends a command, the server hands it to the writer and answers 204 once it has committed. The tile changes only with the next frame over the stream, for you as for everyone else. The board is one view for all tabs and renders at most once per tick. After ten minutes a tile is empty again.
With “200 commands at once” the server itself hands the writer 200 commands at the same moment, from 200 goroutines, each for a random tile in your colour; a single request goes over HTTP for it. Below you see how many transactions they land in and how often the board renders for them.
Tabs watching this board now: …
- Your colour
- …
- Commands
- …
- Transactions
- …
- BEGIN to COMMIT
- …
- Board renders
- …
- Frames to this tab
- …
- The frame: HTML → wire
- …
- Until the 204
- …
- Until the frame
- …
Click a tile, and the numbers above are your click's.
Hypermedia: one compressor per stream, zstd or brotli
Frames go out as Datastar events over server-sent events, formatted once and written to every stream as the same bytes. Each stream compresses on its own, with a window that spans the whole stream, so a frame that repeats the previous one refers back to it. Rendering whole views is affordable only because of this. lith picks the encoder per stream: zstd when the browser accepts it, else brotli, else gzip.
zstd against brotli on the shared board
The same board with 200 streams, in process without HTTP and with synchronous=FULL, medians of six runs on the development machine:
| 200 streams, one board, synchronous=FULL | zstd, fastest level | brotli, quality 4 |
|---|---|---|
| CPU, cores busy | 1.82 | 3.42 |
| Bytes per frame on the wire | 2,217 | 854 |
| Heap per stream | 1.68 MiB | 1.56 MiB |
| Tick p99 | 4.1 ms | 2.1 ms |
zstd sends 2.6 times the bytes of brotli per frame for about half the CPU. Over HTTP, with a load tool on the same machine, the kanban board with 200 tabs on lith v0.2.0 showed the same trade: 2.7 cores and 3,162 bytes per frame with zstd, 5.2 cores and 1,010 bytes with brotli (kanban's benchmarks/RESULTS.md).
The window has to reach the previous frame
A stream's compressor remembers the bytes it sent last, as far back as its window reaches. When one card on the board changes, the new frame is the previous one but for that card, and the compressor can say so in a few bytes: "repeat what came 142 KB ago, then these new bytes". It can only do that while the previous frame still fits in its window. With a window smaller than the frame, the start of the previous frame has already dropped out, and the compressor has to send the frame almost as if it were the first.
With brotli at quality 4, the same frame of the 142 KB board takes 9,849 bytes with a window of 217 (128 KiB), but only 95 bytes with 218 (256 KiB): 142,067 bytes of HTML in 95, about 1,500 times smaller. zstd falls less steeply: 10,831 bytes at 217, 2,703 at 218, 1,471 at 219 and 794 at 220. gzip, whose window is 32 KiB, takes 13,169 bytes. lith's stream budget therefore gives each stream the smallest window that holds its largest frame, plus a sixteenth.
Memory per open tab
An open tab holds its encoder for as long as it stays open, so memory per stream decides how many tabs a server can hold. Datastar's Go SDK, given WithBrotli without WithBrotliLGWin, keeps brotli's default window of 4 MiB: 9.9 MiB of heap per stream at quality 5. Multiplied by 1,000 streams, the encoders would hold about 9.7 GiB there, 1.6 GiB with lith's default (zstd's fastest level at 219) and 1.0 GiB with ZstdLowMemory. That projects the encoders' heap alone, not a server with 1,000 HTTP connections.
Projected encoder heap for 1,000 streams
zstd benchmark variance under background load
zstd's CPU figures depend on what else the machine does. On the development machine we alternated four zstd runs on the board with and without twelve low-priority busy loops (nice -n 19 yes) on the same cores. With the loops, the process used 0.80 and 0.86 cores at a tick p50 of 1.25 ms. Without them it used 1.50 and 1.90 cores, at 1.7 and 4.1 ms.
Between ticks the zstd process leaves most of its cores idle, and cores that keep falling idle take longer for the same work. Either the CPU's power management (intel_pstate in powersave) or the scheduler moving threads to idle cores causes it; our runs do not tell the two apart. brotli keeps three cores busy by itself and varies less. The kanban board shows the same in the clock speed: its cores averaged 1.9 to 2.8 GHz with zstd and 2.4 to 3.4 GHz with brotli.
Default compression: zstd at 219
For most apps the limit is memory per open tab, and zstd needs about half of brotli's CPU. So lith's default is zstd's fastest level at 219, about 1.65 MiB per stream. brotli serves the browsers without zstd, Safari before 26.3 among them. Only zstd streams can also hibernate, giving back their encoder while a tab is idle; the next section says why.
This tab's stream
While this box is in view, the server sends it again once a second, over the stream this tab holds open. Each frame repeats the last one but for a few numbers; the numbers below are the stream's own, before and after compression.
- Compression
- …
- Window
- …
- Sent so far
- …
- Ratio
- …
- Last frame
- …
Connecting …
SQLite, Chromium and brotli findings
- Preparing statements again. The pure Go SQLite driver (modernc.org/sqlite) prepares a statement again on every call. In the kanban board that cost 41% of the writer's CPU. Once the writer prepared each statement once and kept it, the board went from about 10,000 to 13,800 moves a second. lith's writer keeps the 512 statements it used last, and each read connection keeps 128.
- A bound
LIMIT ?defeats the cache. SQLite 3.53 reads a boundLIMITwhen it prepares a statement and prepares it again whenever the parameter is bound, which the driver does on every call. WithLIMIT 20written into the SQL, the cache made a read 28% faster (21.6 against 29.8 µs); withLIMIT ?, only 17% (25.2 against 30.4 µs). The measurement is in bench/RESULTS.md, read pool statement cache. - Chromium drops a second brotli stream. A stream that hibernates gives back its encoder and starts a new compressed section when it wakes. Chromium 154 decodes a zstd body of several frames event by event. Given a brotli body that holds a second brotli stream after the first, it decodes the first and drops the second without an error. So only zstd streams hibernate. After 30 s idle a tab then holds 0.106 instead of 0.640 MiB, for about 45 KB more on the wire per tab and hour. The test is sse/chromium_test.go, the numbers are on the docs' hibernation page.
- brotli needs flushes inside a frame. Without a flush every 16 KiB (quality 3) or 32 KiB (quality 4), brotli extends a copy into the next input block without hashing it, and after a change in a large frame it loses track of the frame before. A 230 KB board at quality 3 and 218 took 3,173 bytes a frame; with the flushes it takes 259 (large frames and brotli's flushes, changelog of v0.2.0).
What lith leaves to the app
lith owns the runtime and nothing above it. It has no router: routes stay with net/http. It has no template engine: the HTML comes from templ. It has no domain model: each app keeps its own pages, tables and commands.
A first command and live view
A feature on lith is a command, a handler and a view, tied together by a topic. This is the shared counter from the docs page The first command and view, shortened; the docs add validation, the query function, the templ component and the page.
// A command: Apply runs in the writer's batch, in a savepoint.
type Add struct{ N int }

func (c Add) Apply(tx *writer.Tx) error {
	if _, err := tx.Exec(`UPDATE counter SET count = count + ? WHERE id = 1`, c.N); err != nil {
		return err
	}
	tx.Touch("counter") // the topic: views on it render in the next tick
	return nil
}

// The handler waits for the commit and answers 204.
err := s.w.Do(r.Context(), Add{N: 1})

// A view: its key, its topics, and a render from the database.
live.View{
	Key:    "counter",
	Topics: []string{"counter"},
	Render: func(ctx context.Context, tx *sql.Tx) (any, error) {
		var n int
		if err := tx.QueryRowContext(ctx, `SELECT count FROM counter WHERE id = 1`).Scan(&n); err != nil {
			return nil, err
		}
		return sse.PatchElements([]byte(fmt.Sprintf(`<p id="counter">%d</p>`, n))), nil
	},
}
Touch names what changed. After the commit, every view that lists the topic renders once in the next tick, and the same frame goes to every tab that watches it, the one that clicked included. The template's guestbook adds an op id per action and a view per tab that brings back the action's outcome.
Deployment scope: one process, one host
- One process per database. A lith app is one binary that keeps its state in one SQLite file (Deploying). The writer holds the file's only write connection, and the hub learns of commits from that writer, in the same process. lith has no setup for several processes on one database or a hub shared between processes. On a deploy the old process stops and the pages reconnect to the next one.
- No horizontal scaling, no failover. lith runs on one host: it does not spread an app over several servers, and it has no failover. Litestream's replica is there to restore from, not a second server that takes over. Within one process, an app whose accounts share nothing can keep one SQLite file per account (One database per account).
- Backups and migrations belong to the app, with lith's tools. The app runs
VACUUM INTOcopies on a timer, or attaches thebackupmodule, which embeds Litestream, replicates every commit to S3-compatible storage, restores a replica each day to check it, and restores the database onto a fresh disk before it opens (Backups). Migrations are numbered SQL files in the app;sqlite.Openapplies those above the database'suser_version, each in its own transaction, and an older binary refuses a newer database (Migrations). - Large single writes. The writer runs one command at a time, so one large write holds every other. Rebuilding the full-text index over 45,000 comments held every command for 2.8 s and gave the pages no frame for 2.9 s; an update of the same table in commands of 1,000 rows kept every other command under 45 ms (the measurements, how to split such writes).
- The API before 1.0. lith is at v0.5.0. Until 1.0 a minor release may change the API, and each changelog entry says what to change in an app (CHANGELOG.md).
Where lith runs
- 2und1.ch. This site. Its SQLite file holds the contact form's outbox and the shared board above, and the live parts of the page come over one stream. Moving it to lith took out 1,510 lines of hand-written Go and put in 635, and the web tests run in 14 seconds instead of 107.
- Starbase, our gallery of Datastar web components, runs on lith in production. With 100 open tabs, after 20 updates, it held 162 MB of memory instead of 1.25 GB; at rest, 161 instead of 438 MB.
- The kanban board from our comparison with PLANKA. That post measured the architecture built by hand; lith is the same architecture as a library. On lith the board commits about 14,500 moves a second at 200 people, and with zstd its server needs half the CPU it needs with brotli.
- Tickit we rebuilt on lith, as an issue tracker with a wiki that several people edit at once.
- Libretto, our software for the total cost of owning a car in Switzerland, is moving to lith, and so are client projects.
Credits
The reasoning behind lith is Anders Murphy's, from his posts and his framework hyperlith. Batching with a savepoint per command comes from him, and ZstdLowMemory is hyperlith's setting. Tickit began as a fork of northstar, and lith is inspired by both. lith builds on Datastar, on modernc.org/sqlite (SQLite in pure Go, which is why everything builds with CGO_ENABLED=0), on klauspost/compress, whose zstd encoder the streams use, and on andybalholm/brotli.
Limitations
- Every number comes from one development machine (an Intel i5-13500 that runs other services too) and one VPS we share with the host's other tenants. The load average of each run is in the results, and zstd's figures move with it, as described above.
- Most benchmarks run in process, without HTTP and without the network: the clients take each frame at once. The kanban board's numbers over HTTP come from a load tool on the same machine as the server.
- The figures for 1,000 tabs are measured per stream and multiplied.
- lith's benchmarks, with their conditions, commands and load average, are in bench/RESULTS.md; the encoder heap per stream, the Datastar SDK's 9.9 MiB included, on the docs' encoders page; the kanban board's numbers over HTTP in kanban's benchmarks/RESULTS.md. The figures for Starbase and this site come from our own measurements during their moves to lith and are not published elsewhere.
Starting a project
lith-new writes a new project from the template, a small guestbook that follows every rule once: a command, a shared view, a per-tab view backed by SQLite, and a button that looks pending until its frame arrives. It comes with tests, CI, systemd and Caddy files, a deploy script with rollback and a backup timer.
go run github.com/zweiundeins/lith/cmd/lith-new@latest ~/develop/guestbook example.com/acme/guestbook
cd ~/develop/guestbook && go mod tidy && go tool task test
The documentation is at lith.zweiundeins.gmbh, the source on GitHub. The repository also ships skills/lith, which teaches a coding agent the rules, recipes and numbers of the version in use.